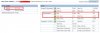
root@host [/usr/local/apache/logs]# tail -f error_log
2015-12-03 12:48:22.000 [INFO] [CLEANUP] Send signal: 15 to process: 19018
2015-12-03 12:48:22.036 [INFO] [76.112.57.244:37525] PID: 11386, add child process pid: 19024, procinfo: 0x16008c0
2015-12-03 12:48:22.102 [INFO] [174.26.134.186:52476] Abort request processing by PID:18981, kill: 1, begin time: 1, sent time: 1, req processed: 12
2015-12-03 12:48:22.223 [INFO] [174.26.134.186:52478] PID: 11386, add child process pid: 19028, procinfo: 0x18ffa60
2015-12-03 12:48:22.240 [INFO] [174.26.134.186:52477] Abort request processing by PID:19014, kill: 1, begin time: 0, sent time: 0, req processed: 1
2015-12-03 12:48:22.293 [INFO] [66.249.88.65:64776] PID: 11386, add child process pid: 19031, procinfo: 0x17000a0
2015-12-03 12:48:22.707 [INFO] [174.26.134.186:52478] Abort request processing by PID:19028, kill: 1, begin time: 0, sent time: 0, req processed: 0
2015-12-03 12:48:22.723 [INFO] [174.26.134.186:52479] PID: 11386, add child process pid: 19036, procinfo: 0x18ffa60
2015-12-03 12:48:23.213 [INFO] [174.26.134.186:52479] Abort request processing by PID:19036, kill: 1, begin time: 1, sent time: 1, req processed: 0
2015-12-03 12:48:23.243 [INFO] [174.26.134.186:52480] PID: 11386, add child process pid: 19039, procinfo: 0x18ffa60
2015-12-03 12:48:24.005 [INFO] [174.26.134.186:52481] Abort request processing by PID:19024, kill: 1, begin time: 1, sent time: 1, req processed: 4
2015-12-03 12:48:24.063 [INFO] [174.26.134.186:52483] PID: 11386, add child process pid: 19049, procinfo: 0x16008c0
2015-12-03 12:48:24.196 [INFO] [174.26.134.186:52482] Abort request processing by PID:19031, kill: 1, begin time: 1, sent time: 1, req processed: 3
2015-12-03 12:48:24.371 [INFO] [96.40.185.62:57111] PID: 11386, add child process pid: 19052, procinfo: 0x17000a0
2015-12-03 12:48:24.509 [INFO] [174.26.134.186:52483] Abort request processing by PID:19049, kill: 1, begin time: 0, sent time: 0, req processed: 0
2015-12-03 12:48:24.522 [INFO] [174.26.134.186:52484] PID: 11386, add child process pid: 19055, procinfo: 0x16008c0
2015-12-03 12:48:24.980 [INFO] [174.26.134.186:52484] Abort request processing by PID:19055, kill: 1, begin time: 0, sent time: 0, req processed: 0
")